 Home
Projects
History
Blogs
Misc
Home
Projects
History
Blogs
Misc
9/20/20 - 8/18/22
Over the course of two years, I did stats for my AAA hockey team. I can't remember how it started, (It was probably my dad trying to get me to learn), but I was tasked with keeping track of personal and team stats for the whole team. How it worked was that the scorekeeper during the game would keep track of all the important events from each game (goals, assists, penalties, etc.) and would give a copy of each game to me. Then, I had to transfer the game details into multiple different google sheets. I then created one final google sheet for the actual stats that the reader should take away. This final sheet had graphs for players like goals, assists, and plus/minus; graphs for the team like goals per period, types of penalties per game, and powerplay percentages; and had a "Key Takeaways" section that summarized the stats for the reader. This Key Takeaways section, often including notes like "We are 15-1 in games where we get 0 penalties," was the most important part of the sheet, as it was a culmination of all the stats and included the most important trends and notes about the team.
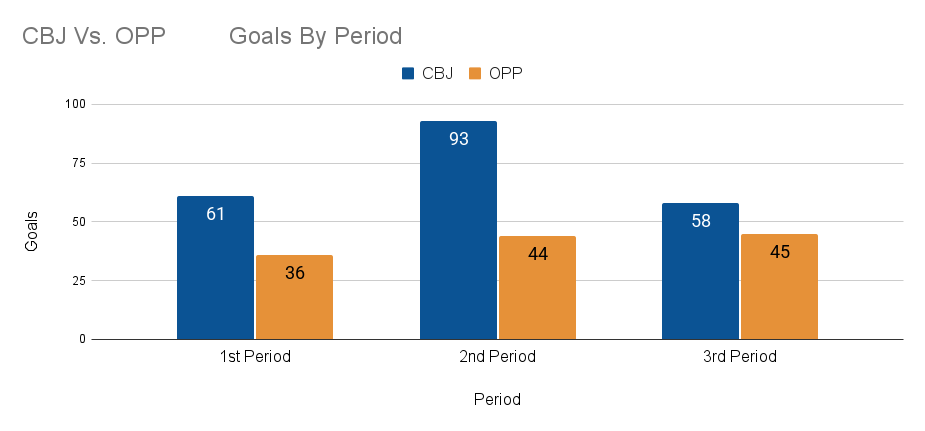
An example graph
Although the stats and takeaways were sparsely used, as we were 10 years old and stats were not a priority, it was cool when coaches would say a couple of my statistical takeaways in the locker room before or during games as a little bit of encouragement. Throughout my two years of doing stats, I learned a lot. I learned how to set up a spreadsheet with function and graphs, I learned how to analyze data, and I learned how to present data in a easily readable and understandable way. Although it was quite a bit of work, I enjoyed doing it and often find myself using skills that I learned from it.